Gantt Chart Project Planner for Excel
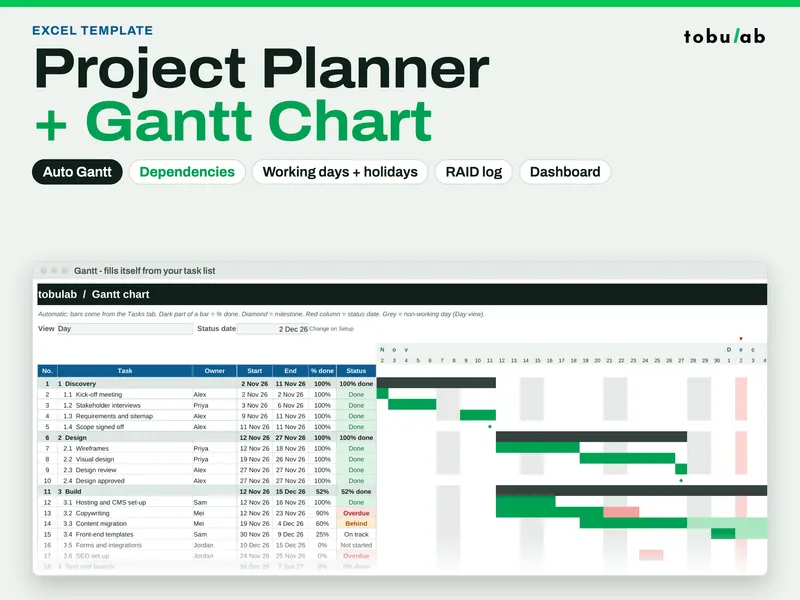
This workbook is for project leads, engineers and small teams who plan in a spreadsheet but are tired of redrawing bars every time a date slips. You enter each task once, with a duration in working days and the task it waits on. The planner works out start and end dates, skips weekends and the holidays you list, and draws the Gantt chart in day or week view. Status, phase progress, team workload and a one-page dashboard follow from the same rows, so the weekly update is mostly typing % done. It is an .xlsx file with no macros, and a script recalculated it in LibreOffice Calc. The download has a filled website-relaunch example to learn from, a blank copy for your own project and a 4-page quick-start guide.
From our listing records. Etsy shows the current price and your local currency at checkout.
Buy on EtsyScripts recalculated this file in Excel for Mac 16.114.3 and LibreOffice. Excel for Windows, older Excel versions and Google Sheets have not been tried.
Instant download from Etsy · nothing shipped
What's included
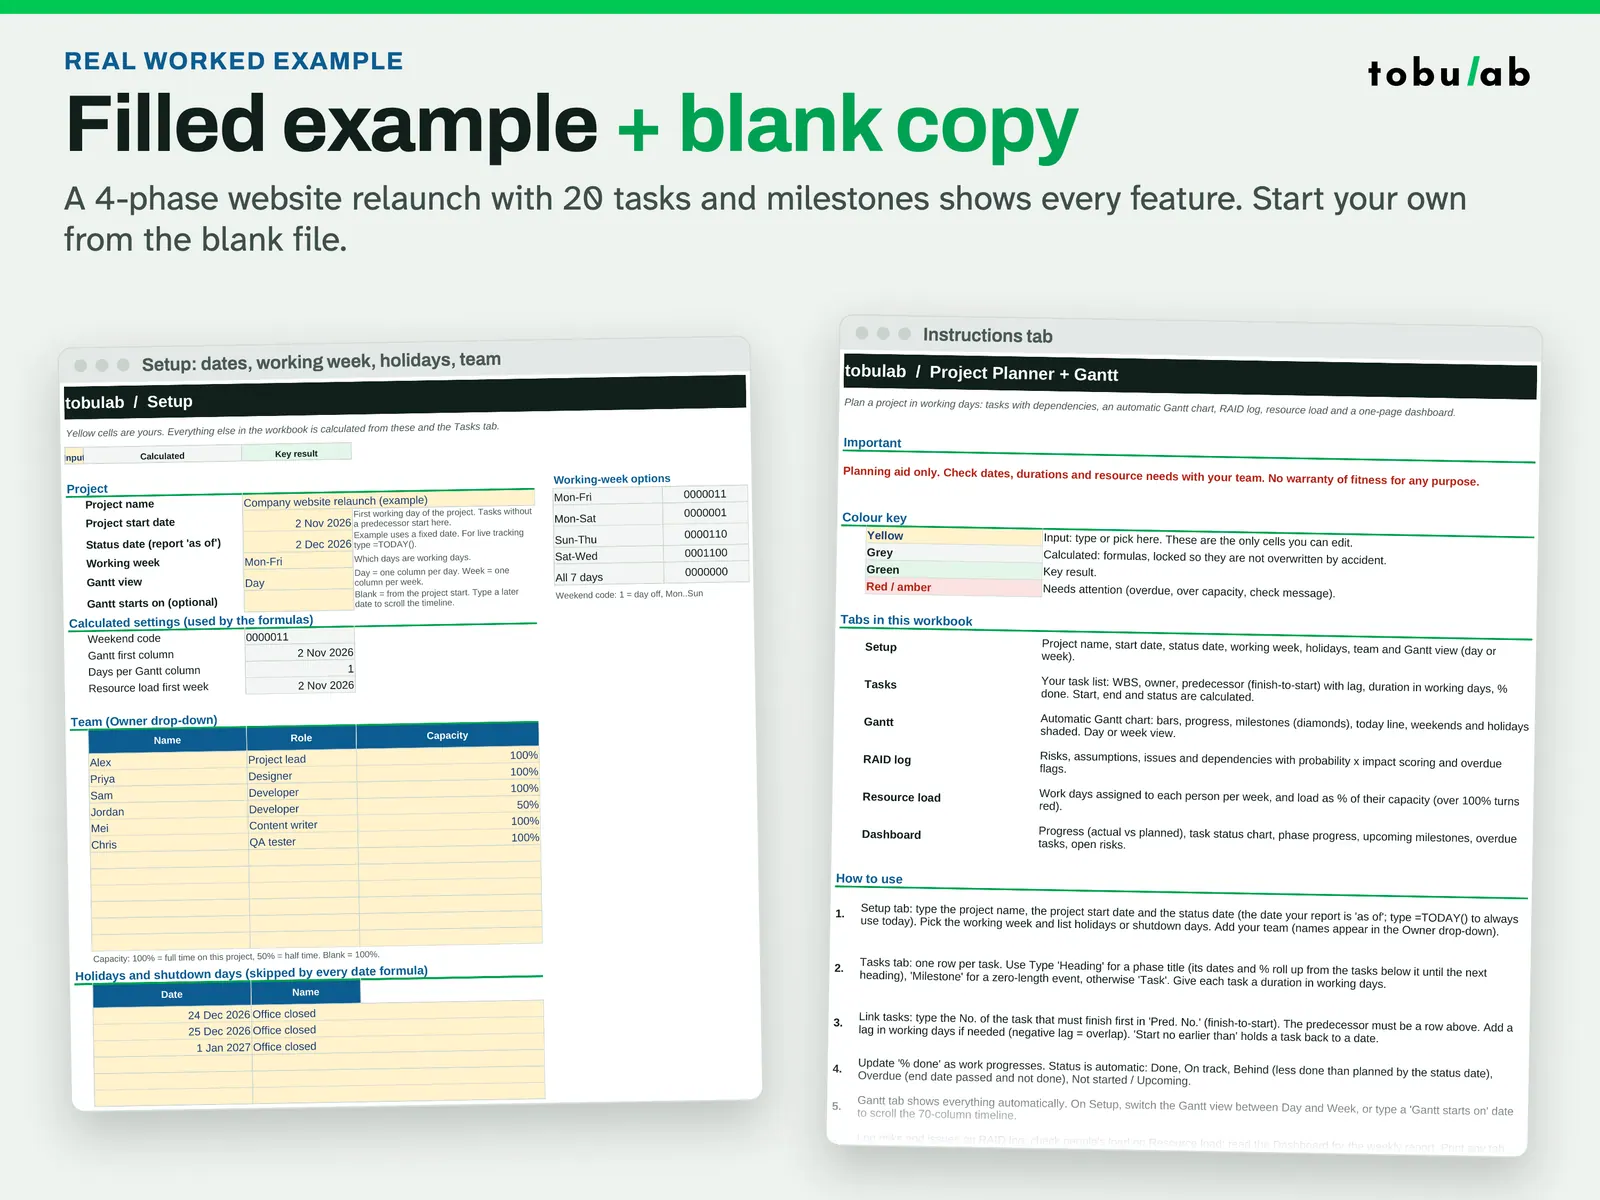
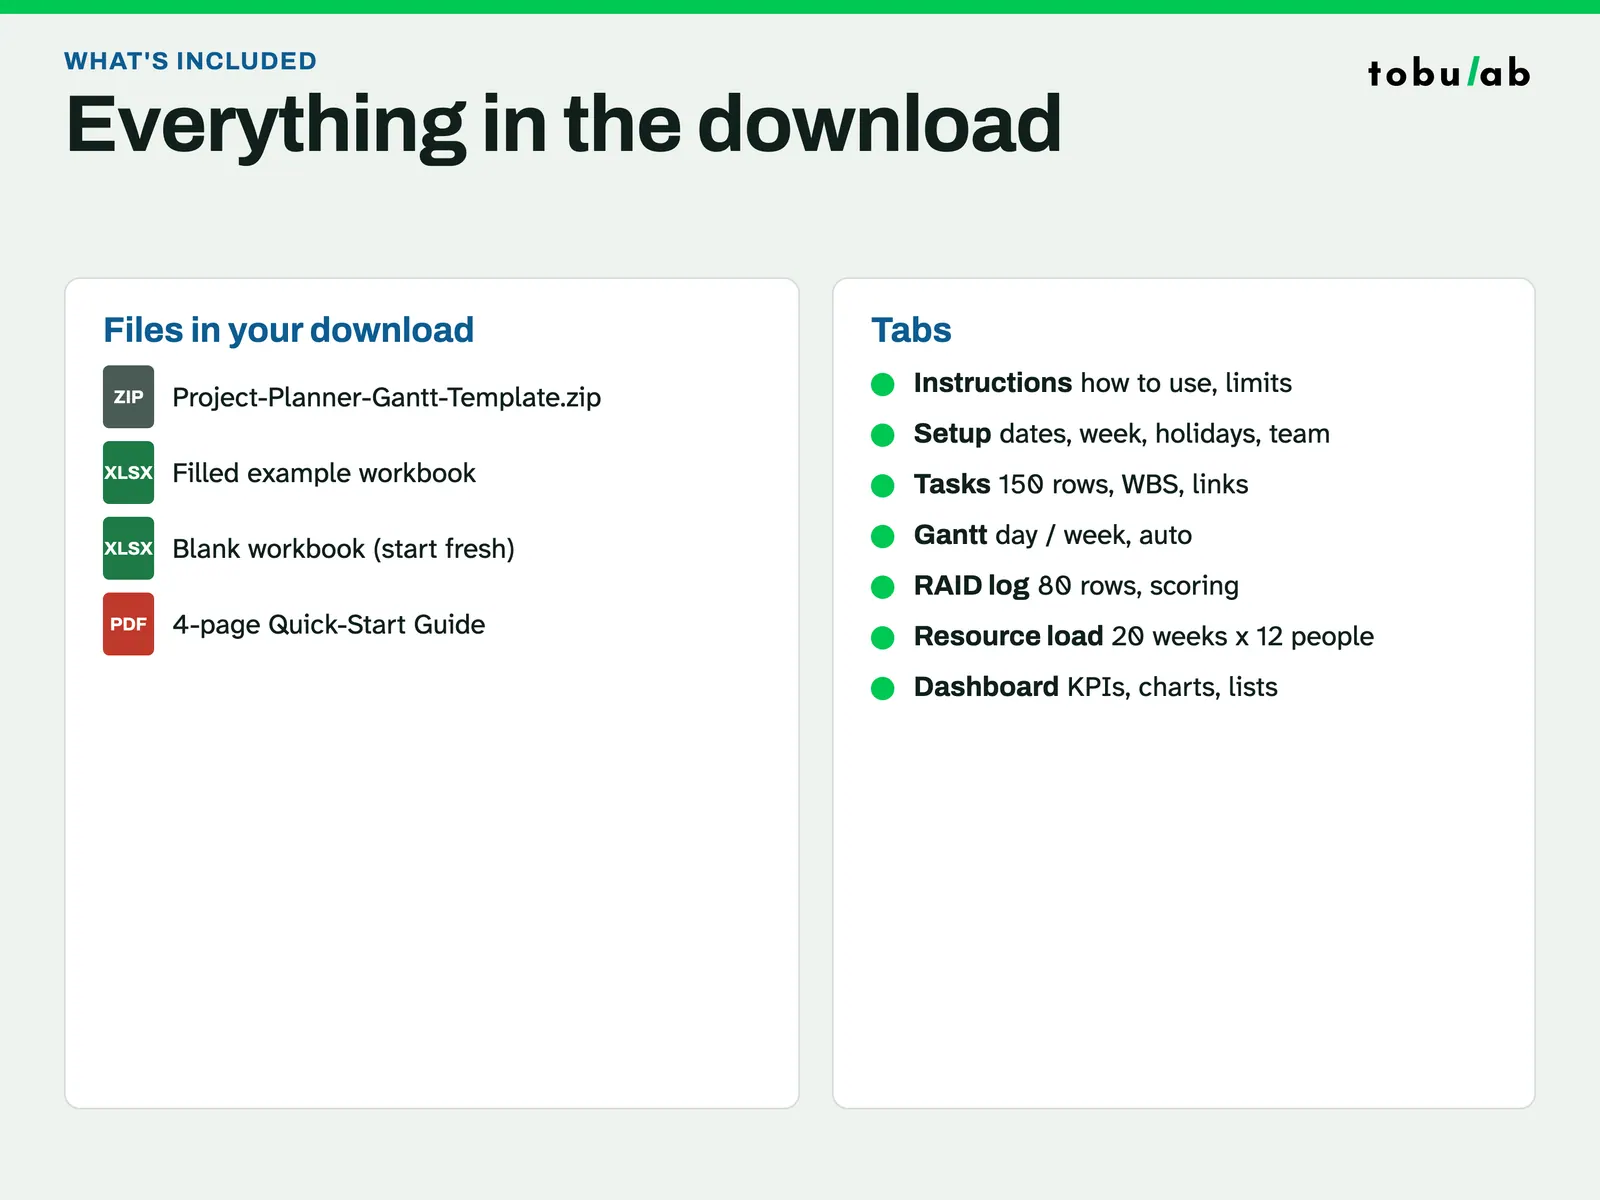
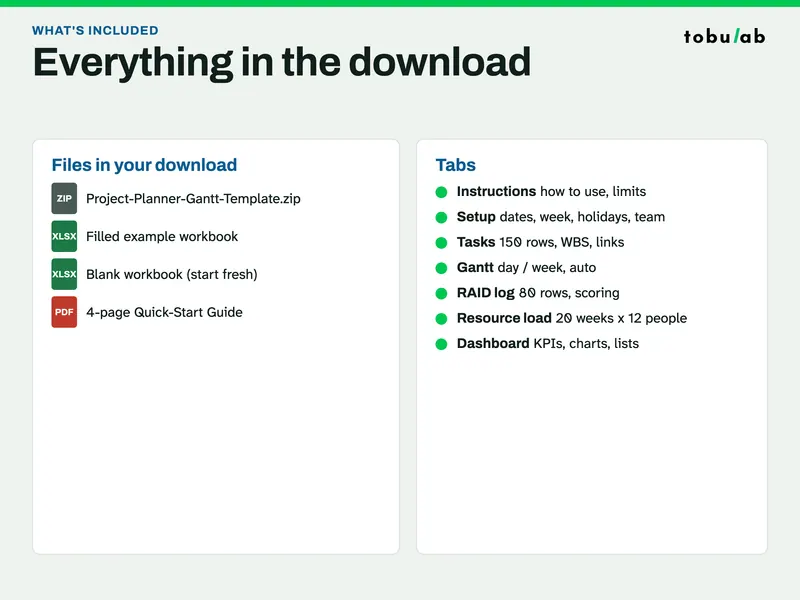
- Project-Planner-Gantt-Template.xlsx: filled example (a 4-phase website relaunch, 20 tasks and milestones, 6 people)
- Project-Planner-Gantt-Template-Blank.xlsx: the same workbook, empty, for your project
- Project-Planner-Quick-Start-Guide.pdf: 4-page quick-start guide
- Tabs: Instructions, Setup, Tasks (150 rows), Gantt (70 days or weeks), RAID log (80 rows), Resource load (12 people x 20 weeks), Dashboard
How it works
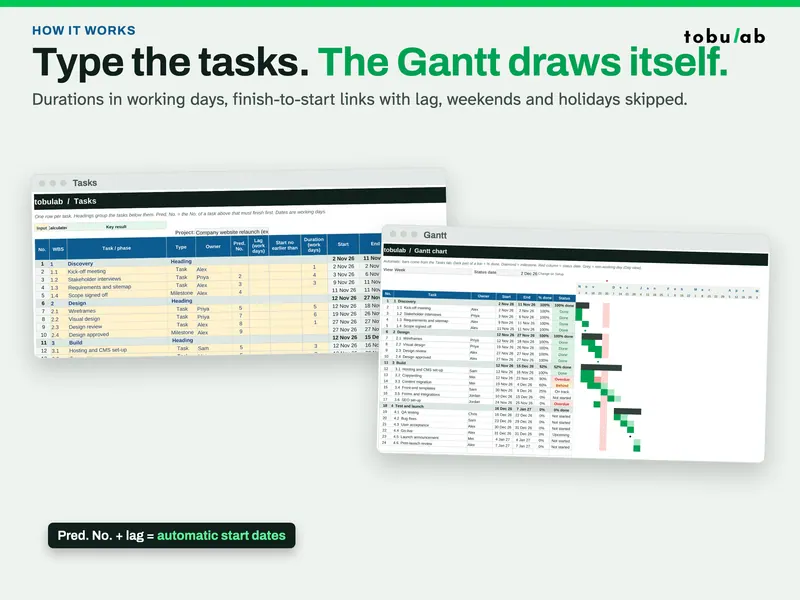
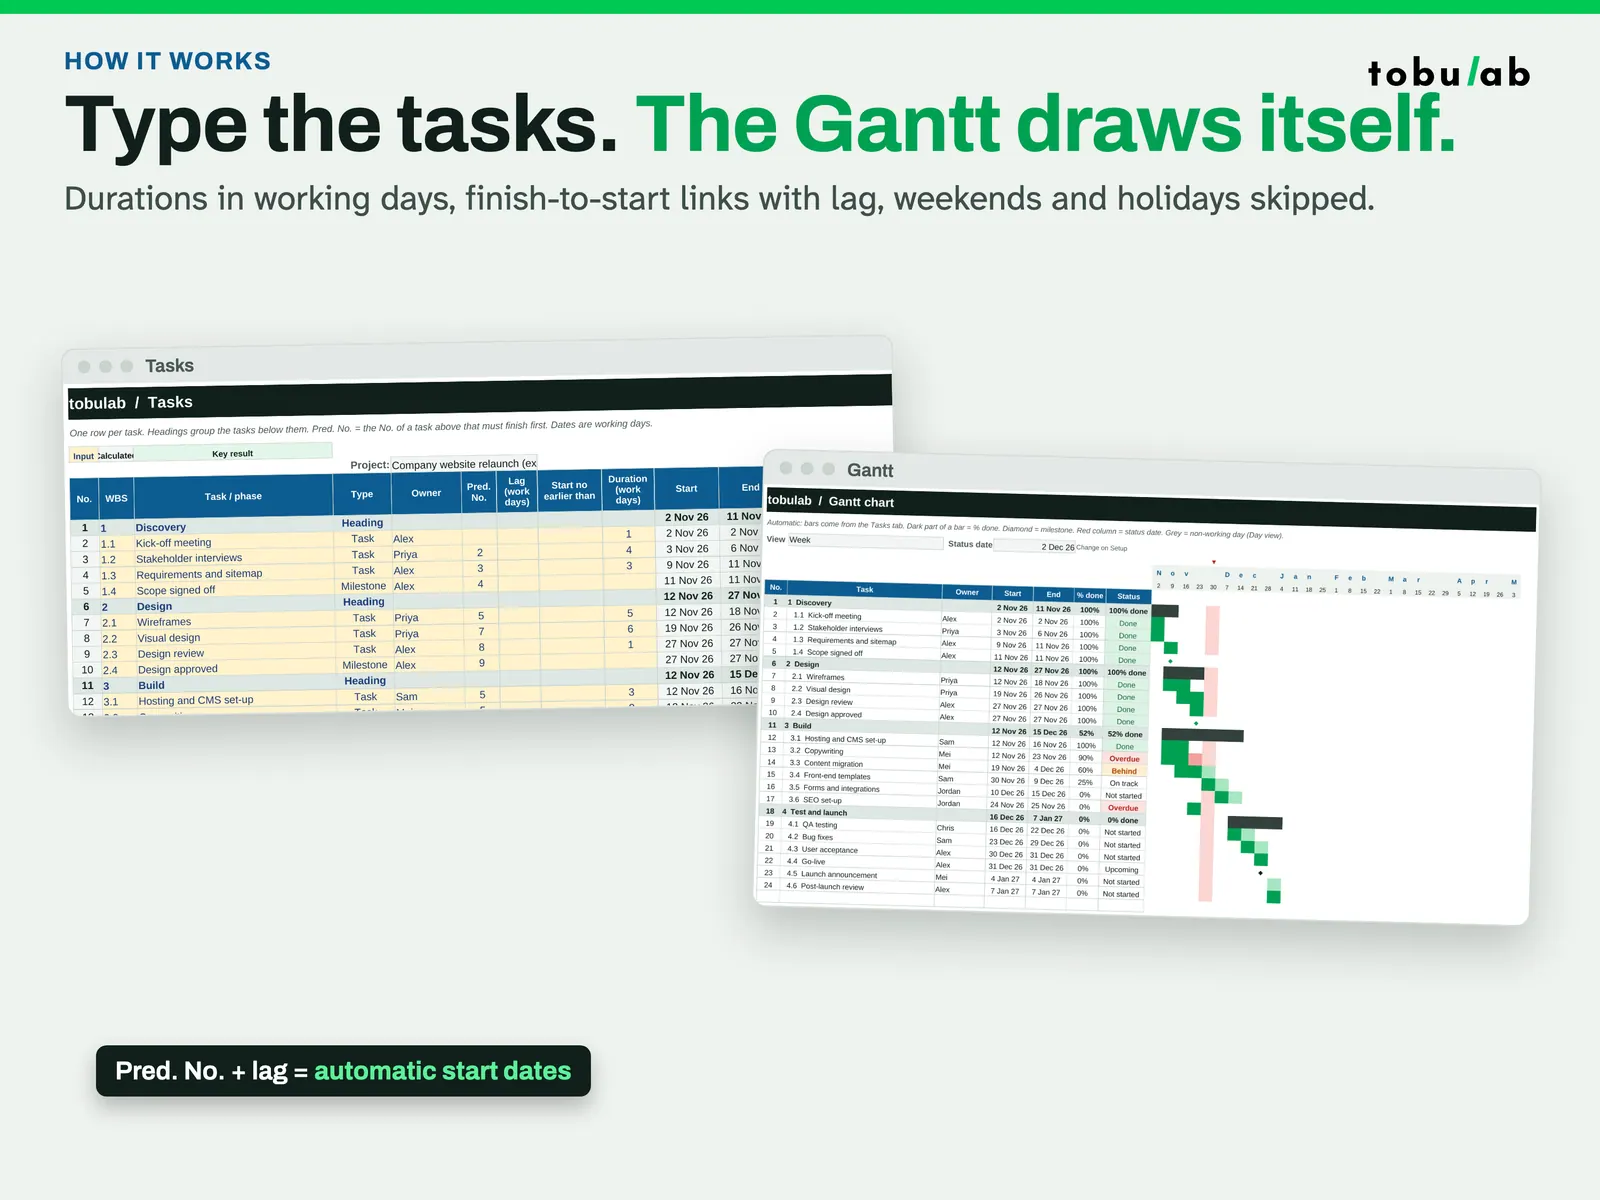
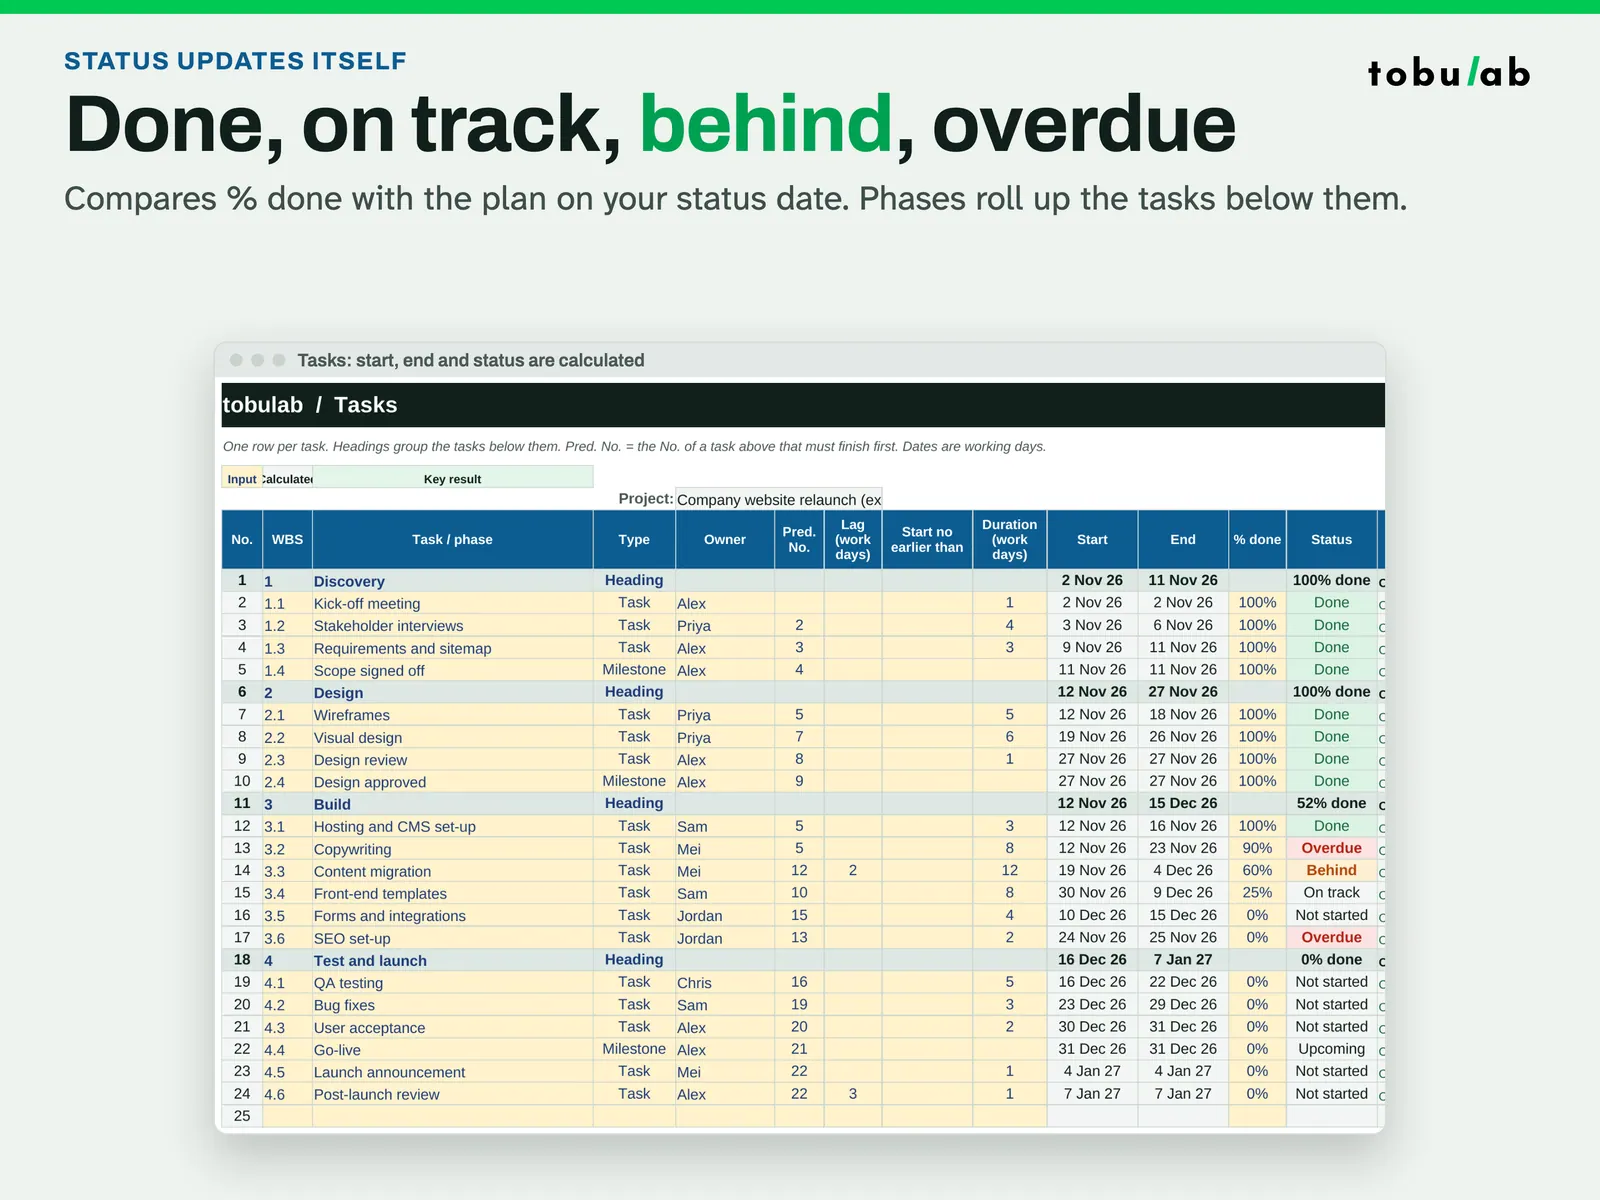
Type the tasks Each row gets a duration in working days and the number of the task that must finish first. The Gantt bars come straight from these rows. 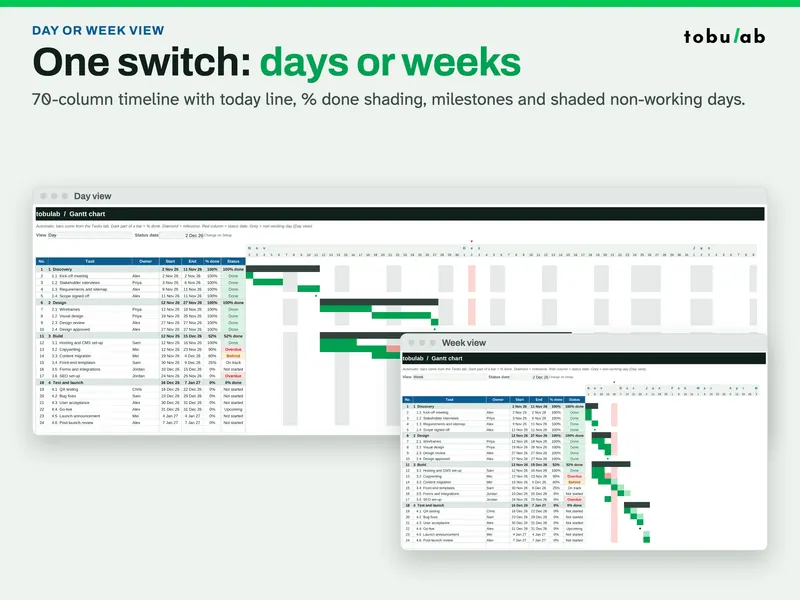
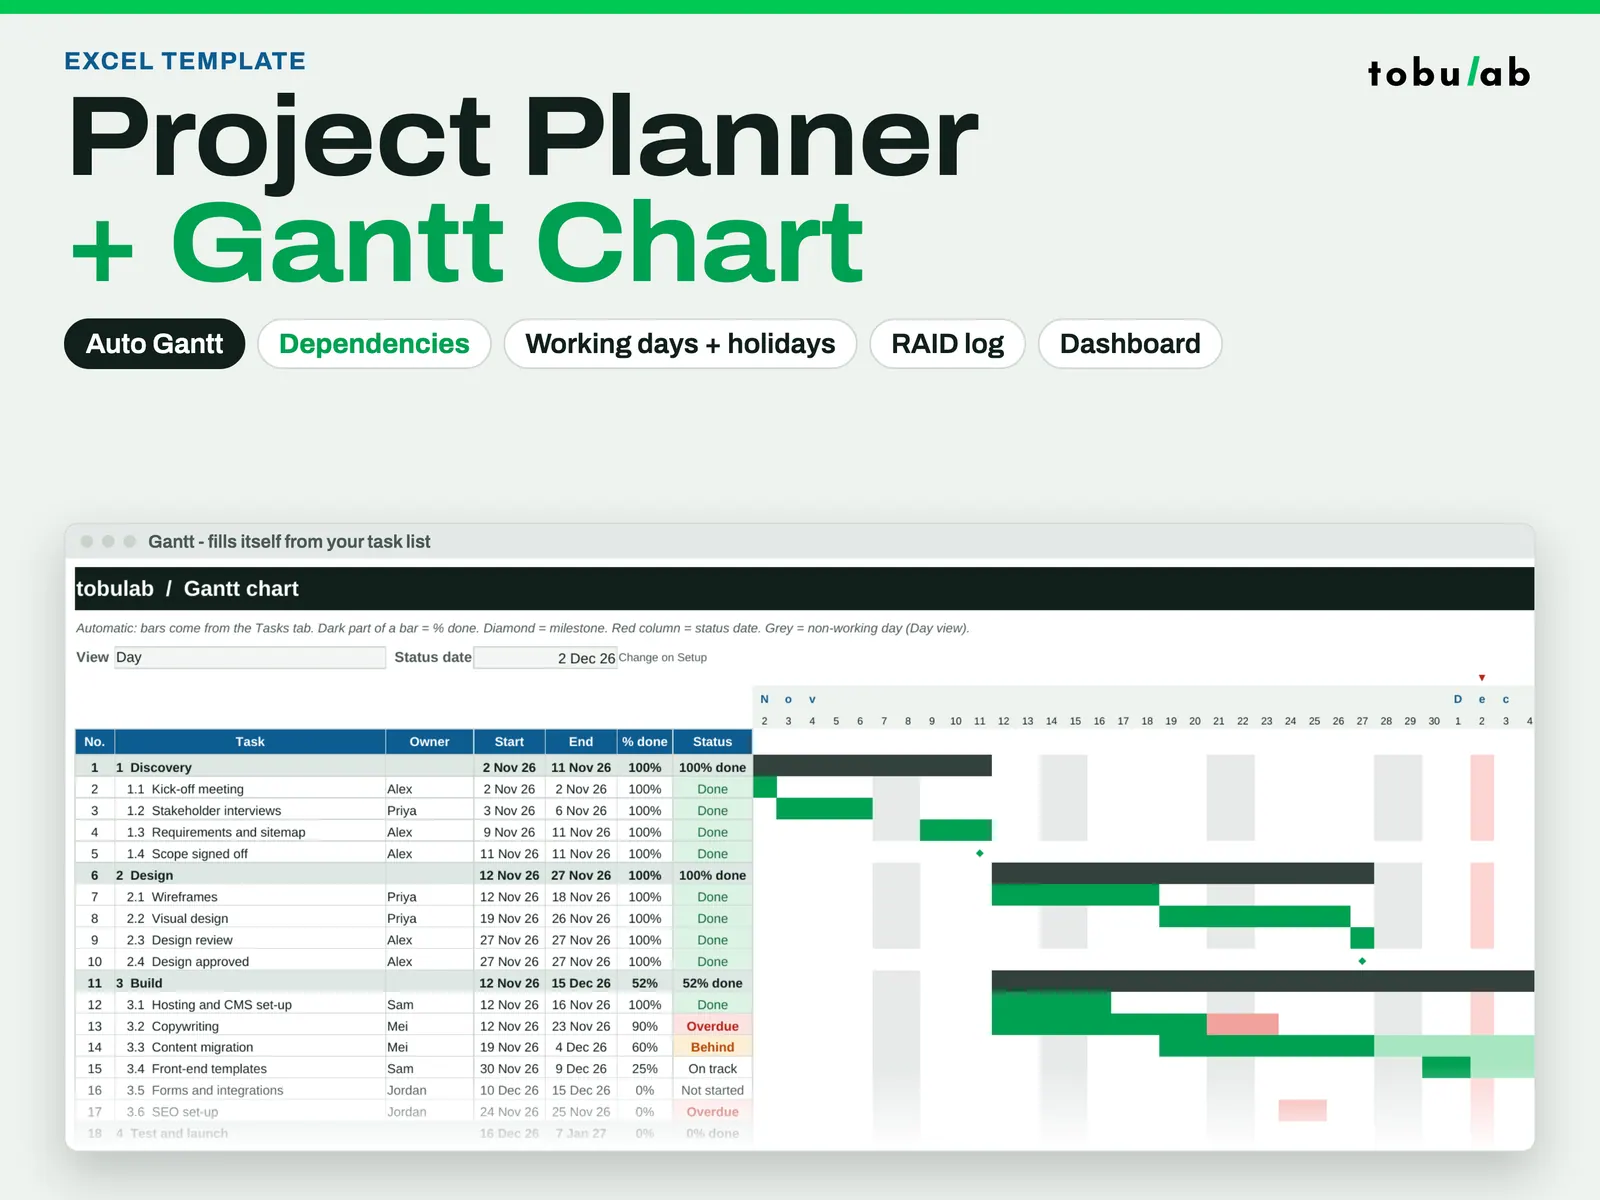
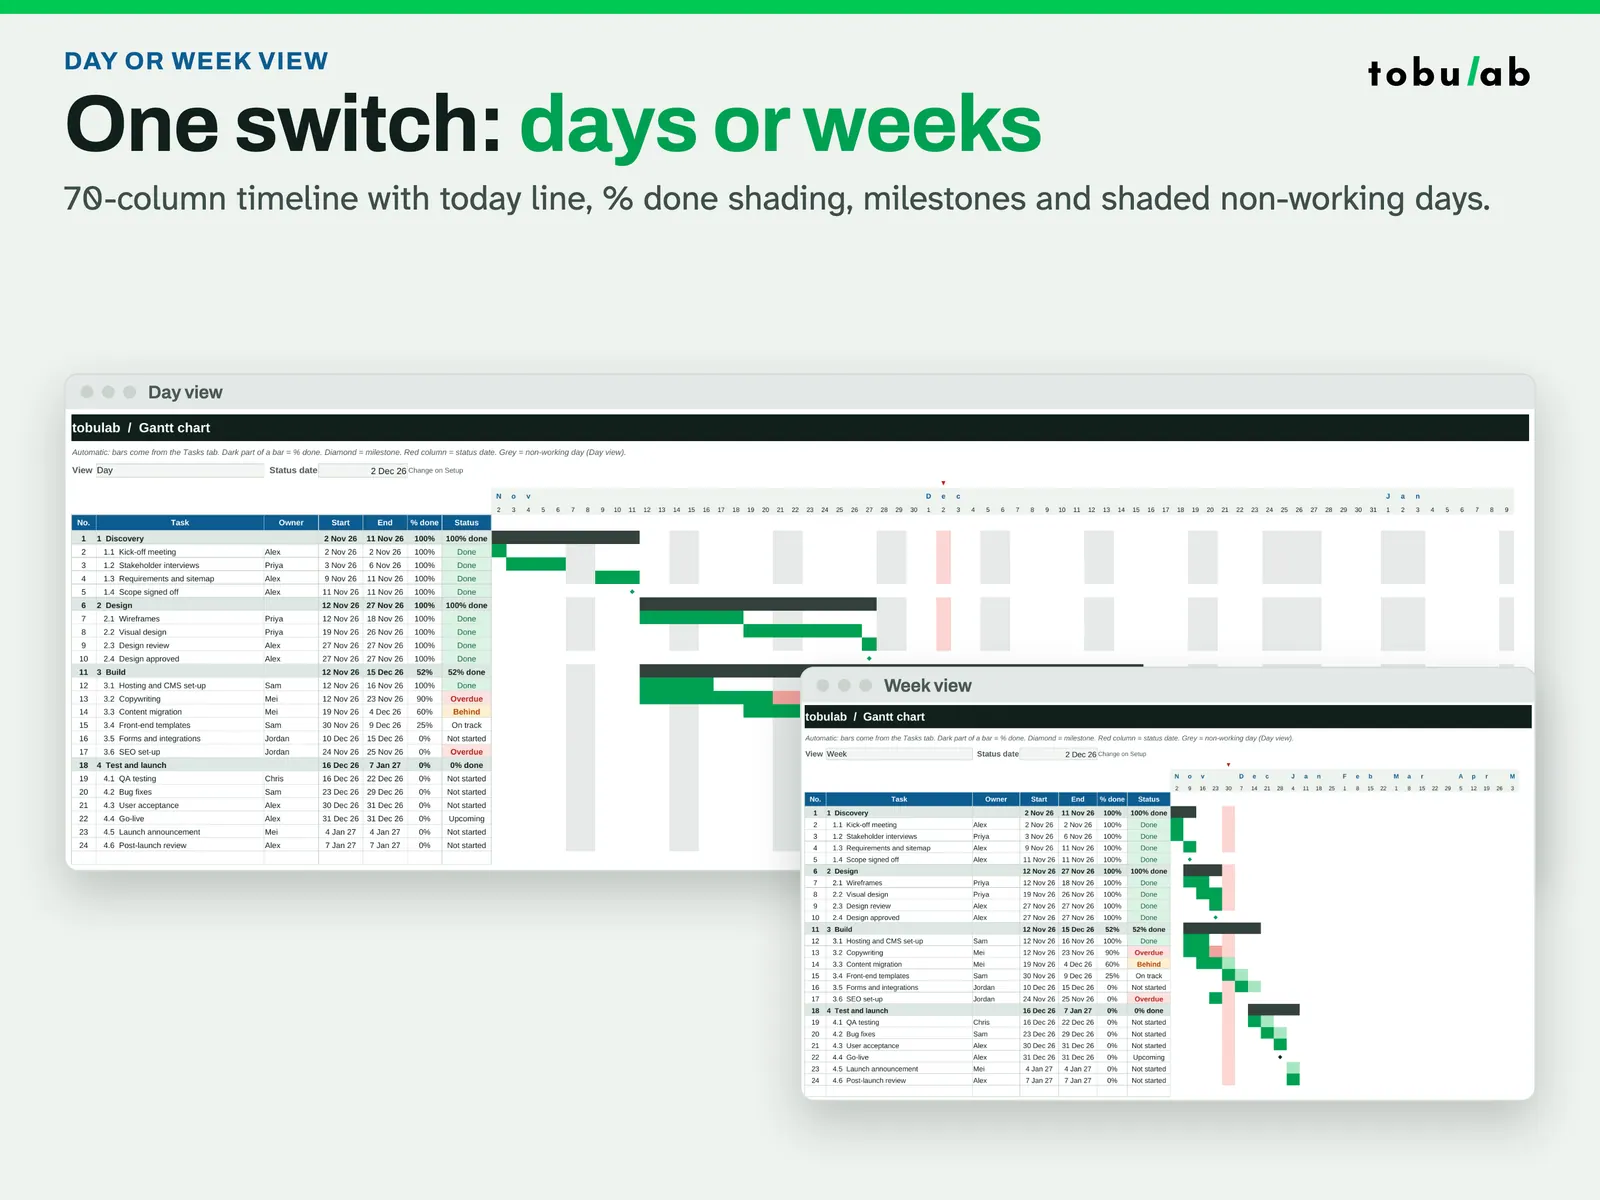
Switch between days and weeks One setting flips the timeline between day and week view, with % done shading, milestone diamonds, the status-date line and grey non-working days. 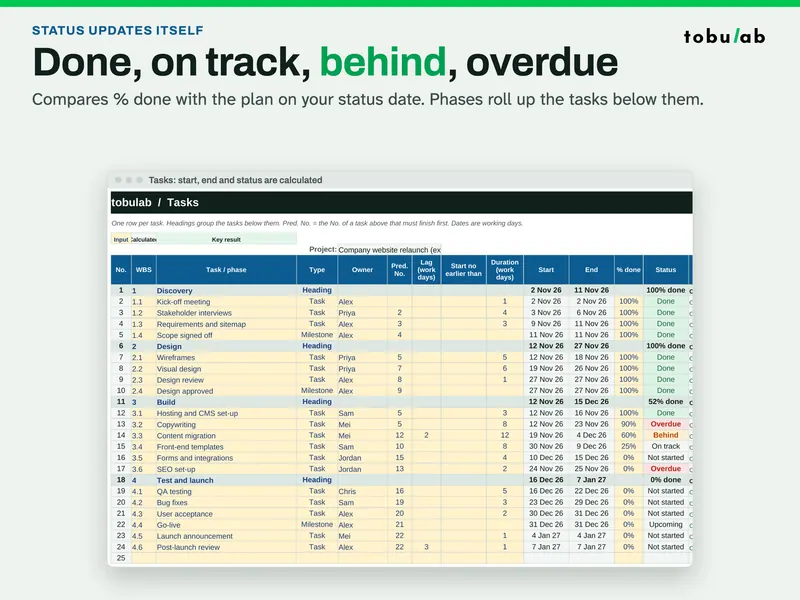
Let status update itself Start, end and status are calculated: % done is compared with the plan on your status date, and phase headings roll up the tasks below them. 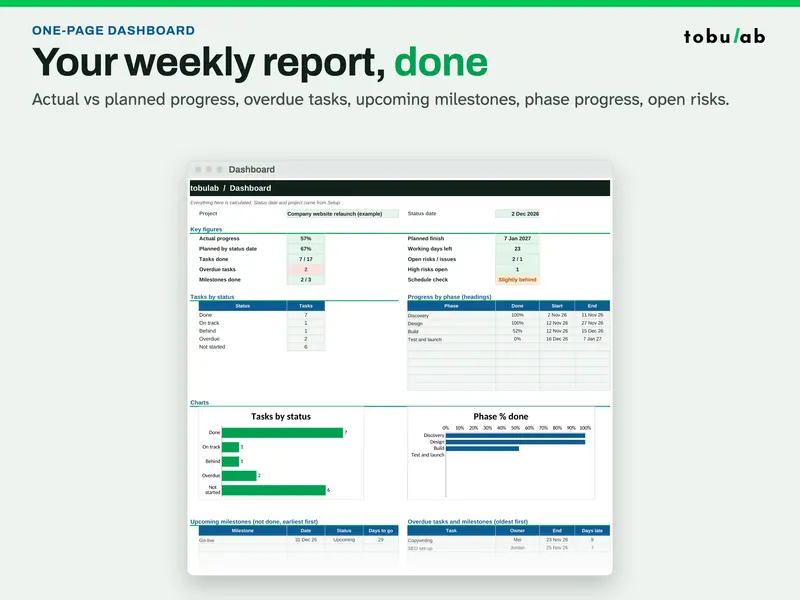
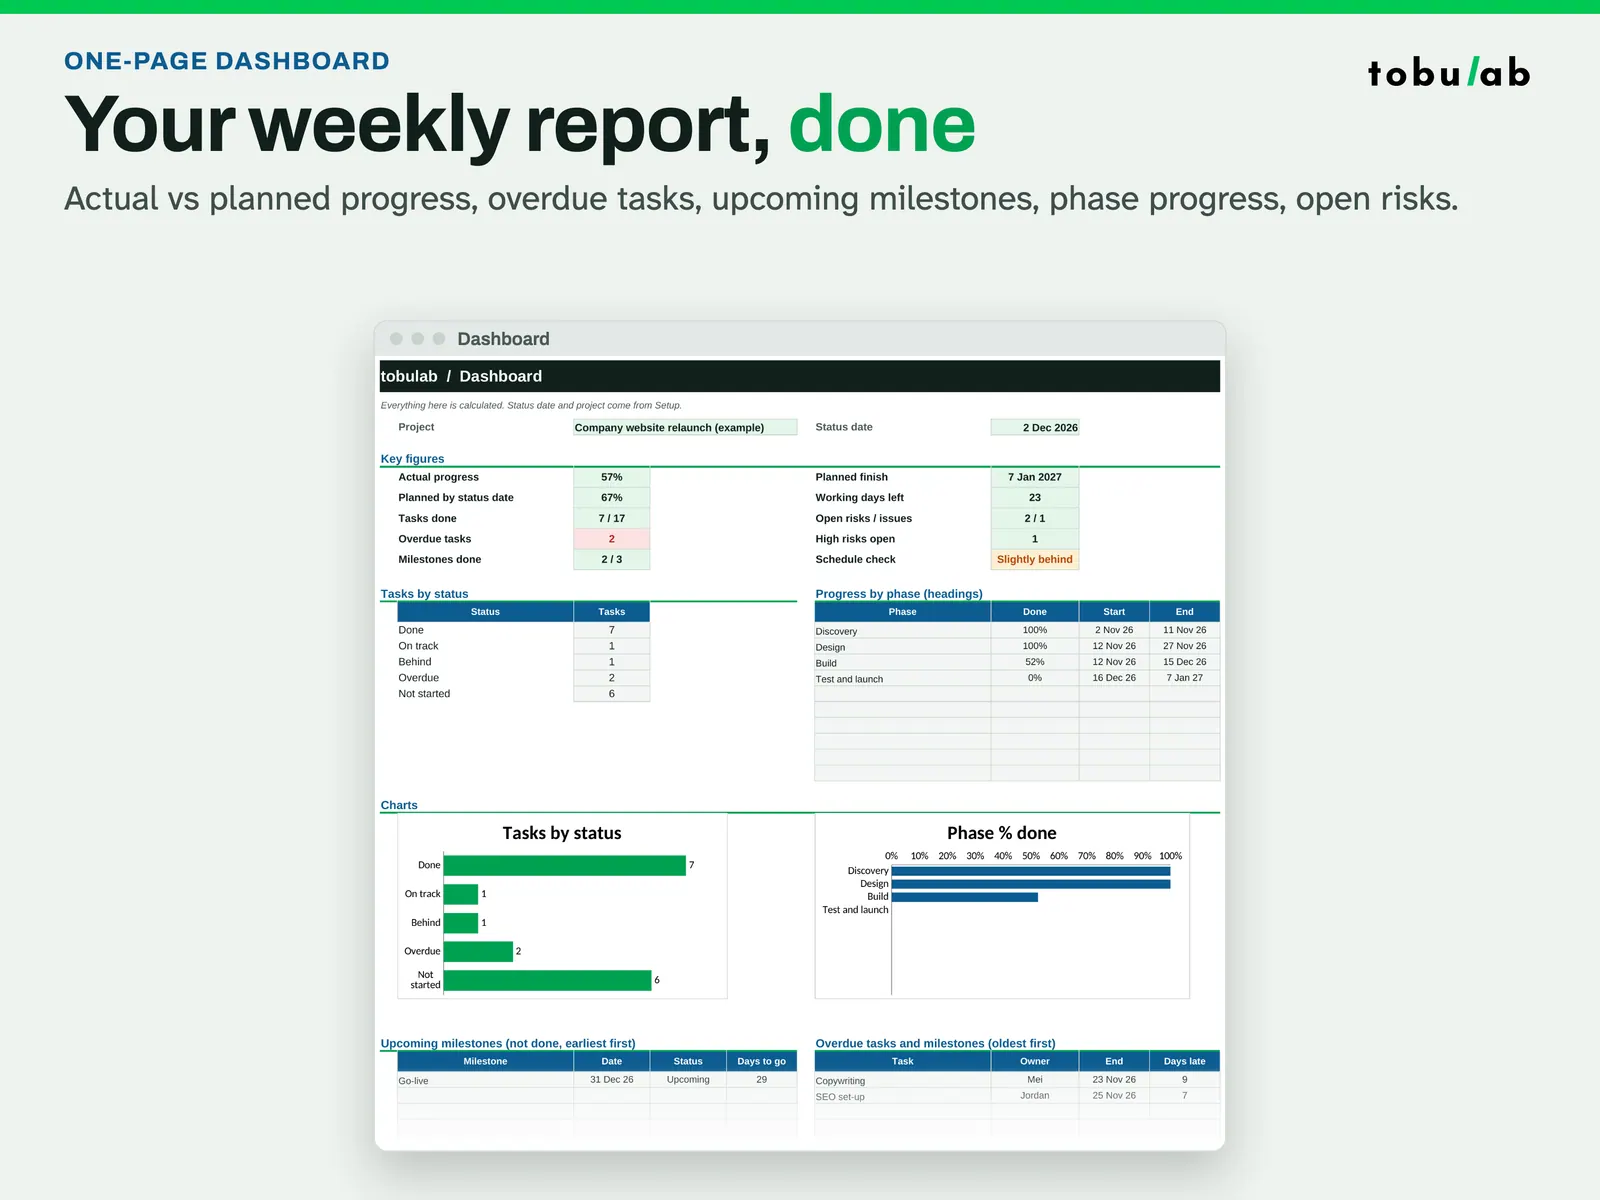
Read the weekly report The dashboard shows actual vs planned progress, overdue tasks, milestones done, tasks by status and progress by phase. 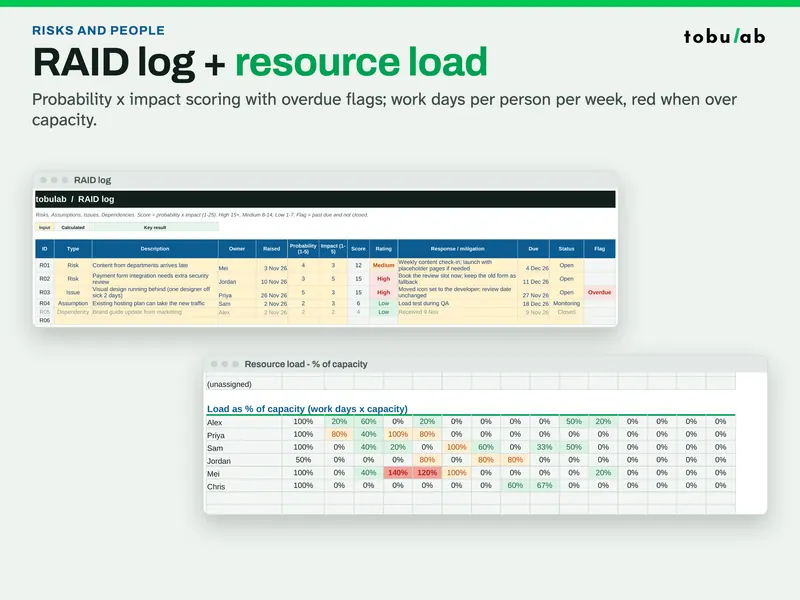
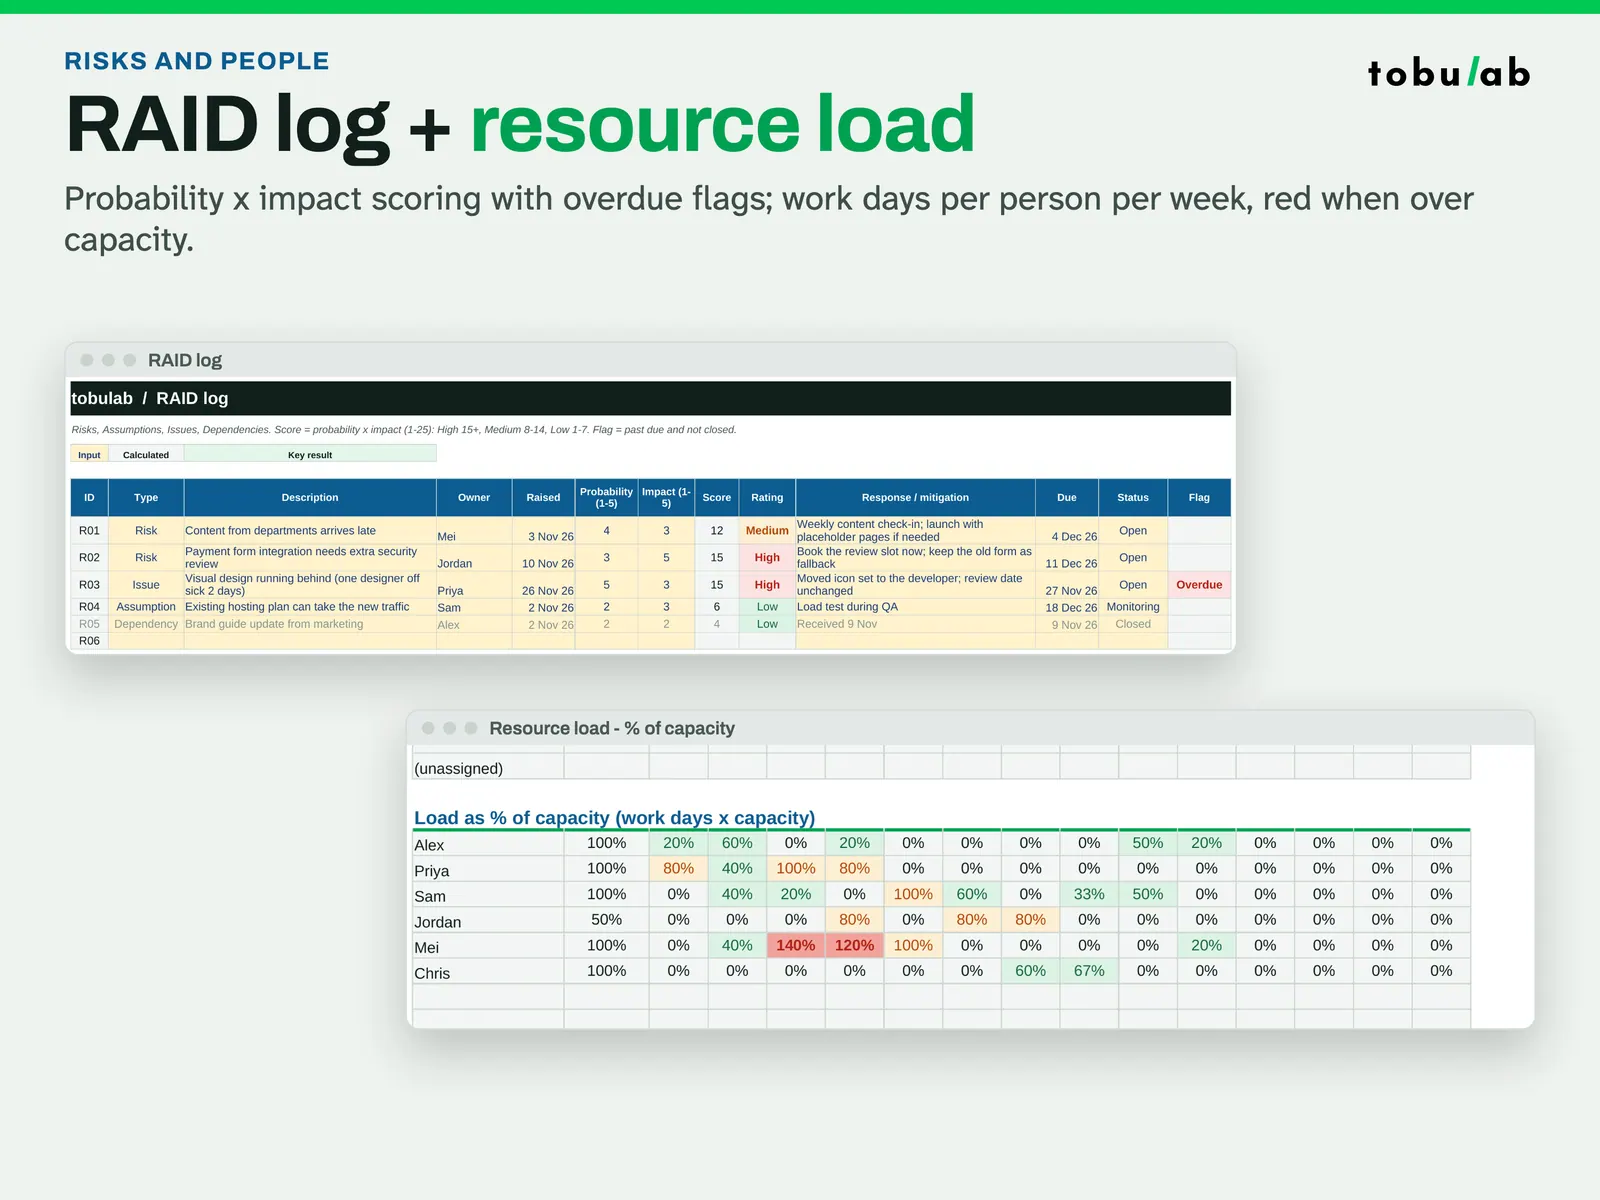
Track risks and people The RAID log scores probability x impact (1-25) and flags items past due; resource load counts work days per person per week. 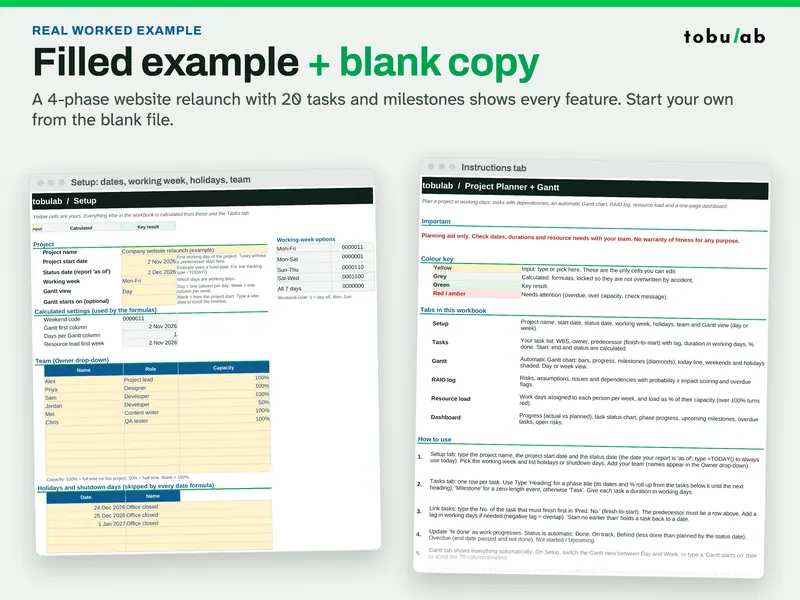
Start from the example or the blank Setup holds the yellow input cells: project name, start date, status date, working week and holidays. Everything else is calculated.
Compatibility and file formats
Scripts recalculated this file in Excel for Mac 16.114.3 and LibreOffice. Excel for Windows, older Excel versions and Google Sheets have not been tried.
Instant download from Etsy · nothing shipped.
Video
Questions
- Does it do dependencies?
Yes: finish-to-start, one predecessor per task, with lag or overlap in working days. To wait for several tasks, link to the one that finishes last.
- Can I use my country's holidays and a Sunday-Thursday week?
Yes. Pick the working week on Setup and type up to 30 holiday or shutdown dates.
- How many tasks?
150 task rows and 12 people out of the box. Unprotect (no password) and copy rows down for more.
- Is there an example?
Yes, a filled website-relaunch project, plus a blank copy.
Planning aid only: check dates, durations and resources with your team. No warranty of fitness for any purpose.
Related
Also included in these bundles:
-
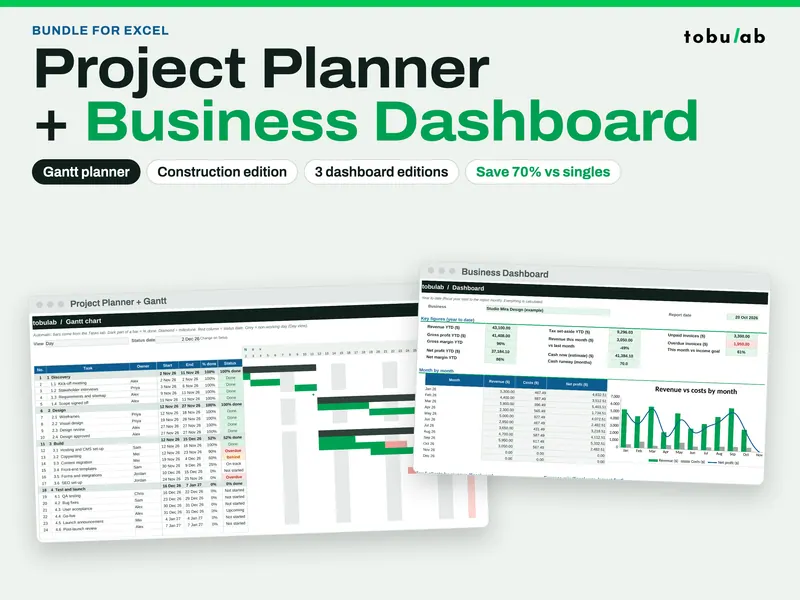
Project Management Bundle: Gantt Planner + Business Dashboard
Five workbooks: plan projects with a Gantt chart and track the business numbers
$5.09 on Etsy -
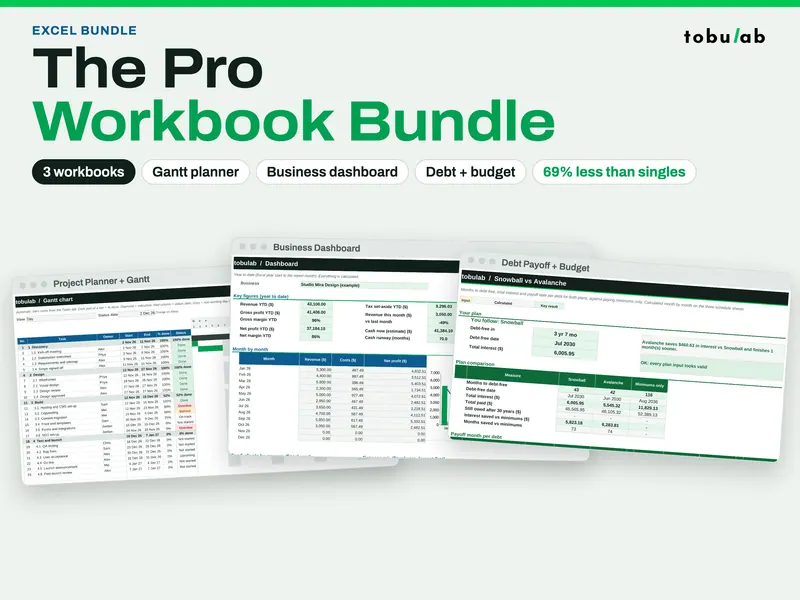
Pro Spreadsheet Bundle (Gantt, Dashboard, Budget + Debt)
Seven workbooks in one download: Gantt planning, business dashboards, debt payoff and budget
$6.49 on Etsy
Guide: How to make a Gantt chart in Google Sheets (2 methods)